eHouse Visualization Creator - drawing views based on individual design or template.
eHouse Visualization Creator/Editor (Scalable Vector Graphics)
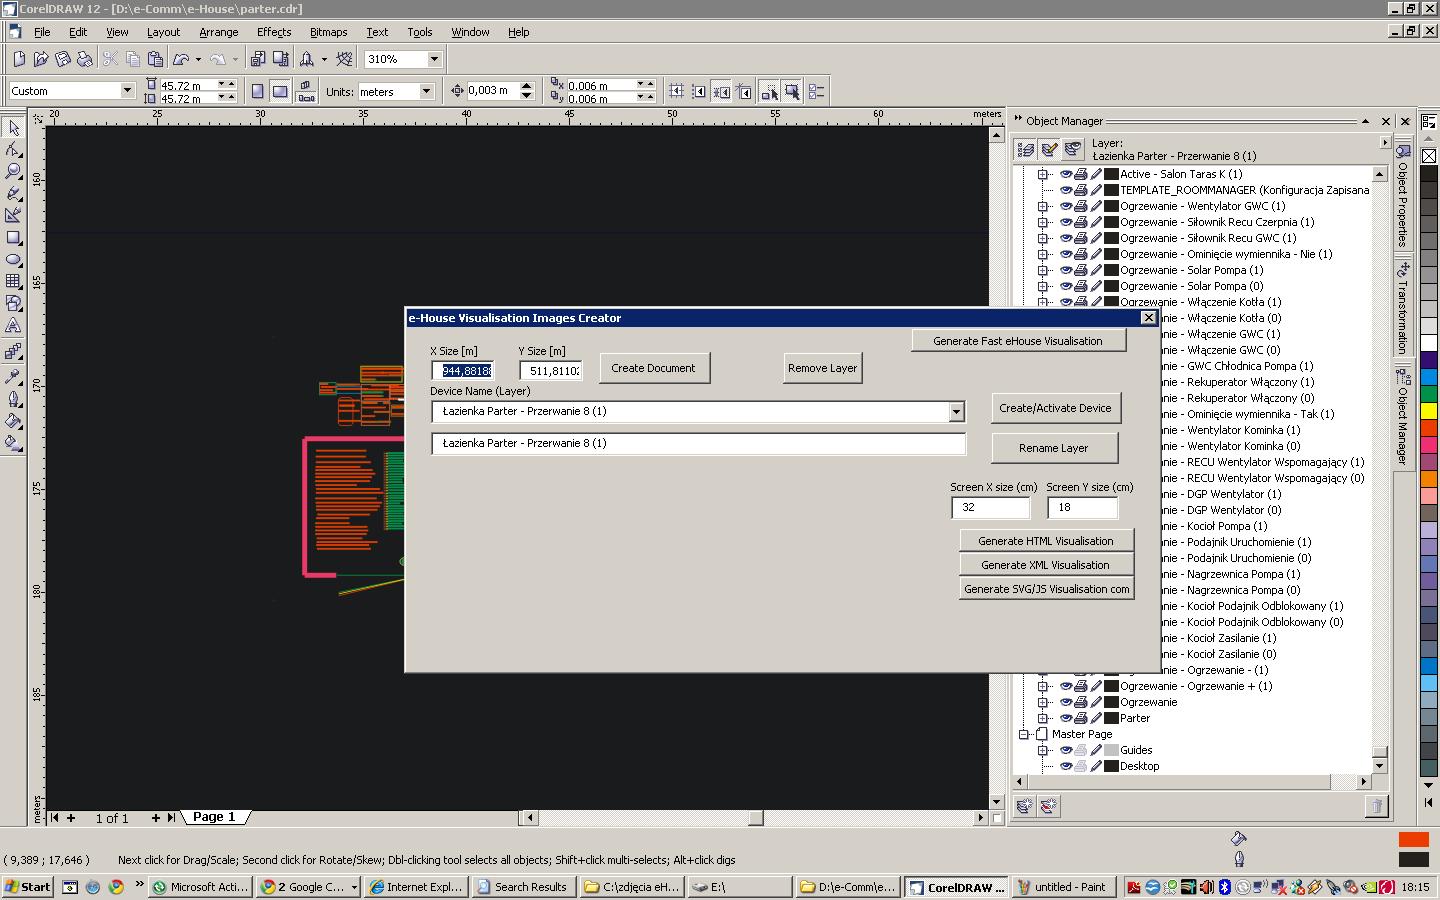
eHouse Visualization Creator/Editor is VBA (Visual Basic for Applications) for Corel Draw which enable:- importing names from eHouse configuration Applications
- Drawing SVG objects: manual, script supported, based on individual template
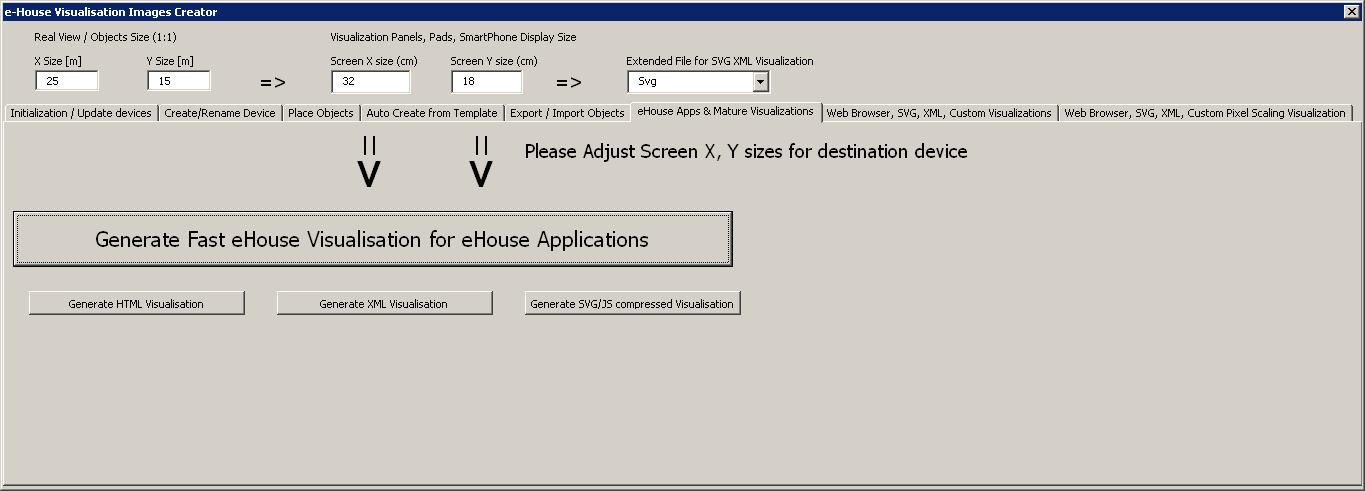
- Creating "Active Views" for graphic control for web browsers, and eHouse Visualization applications for Android, Java, Windows,.Net/.NetCF, etc
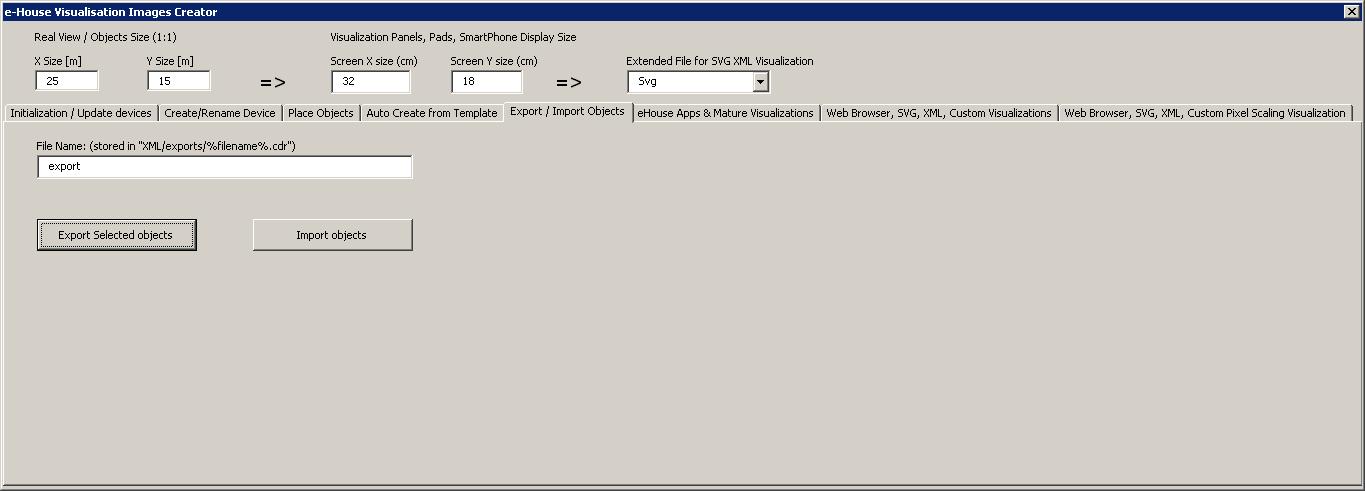
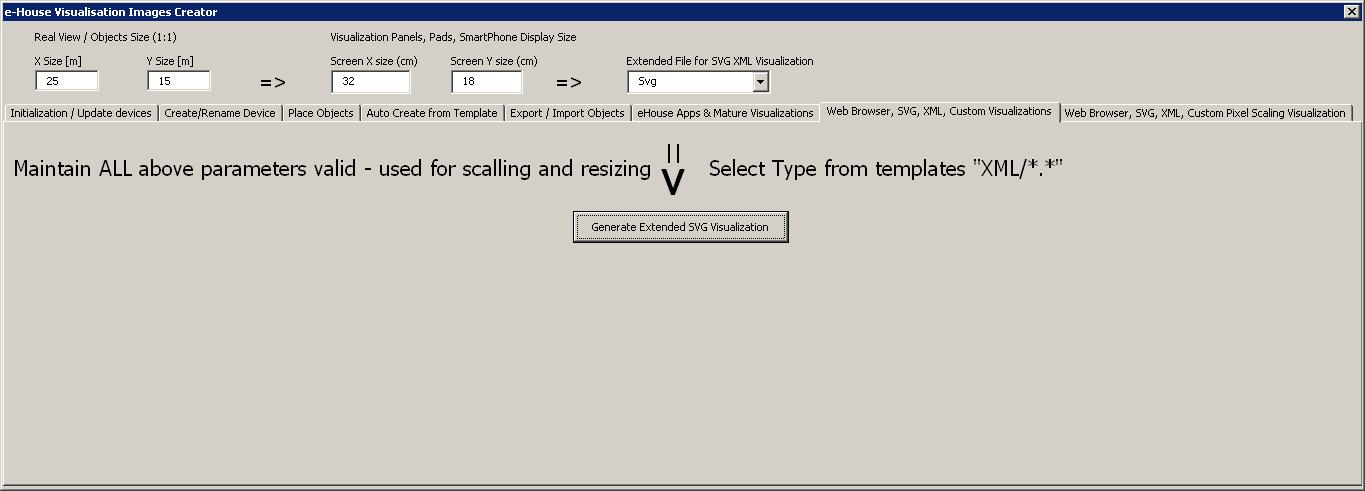
- Exporting Visualizations for: native eHouse Applications, Web Browser pages, Customized Visualizations (based on template) - in text format
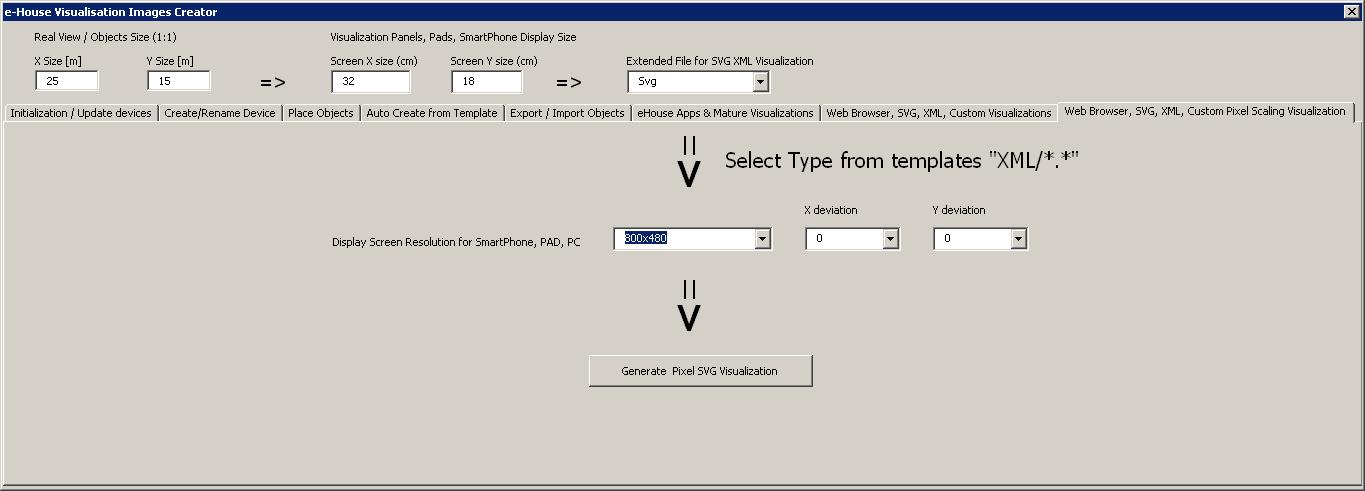
- Exports enable easy customization of screen sizes/resolution
This solution requires Corel Draw Application with VBA support (not available on some limited versions: Home/Student). However, creating of visualization is rather one-time operation, and you can use Evaluation/Trial Full version of Corel Draw to create visualization.
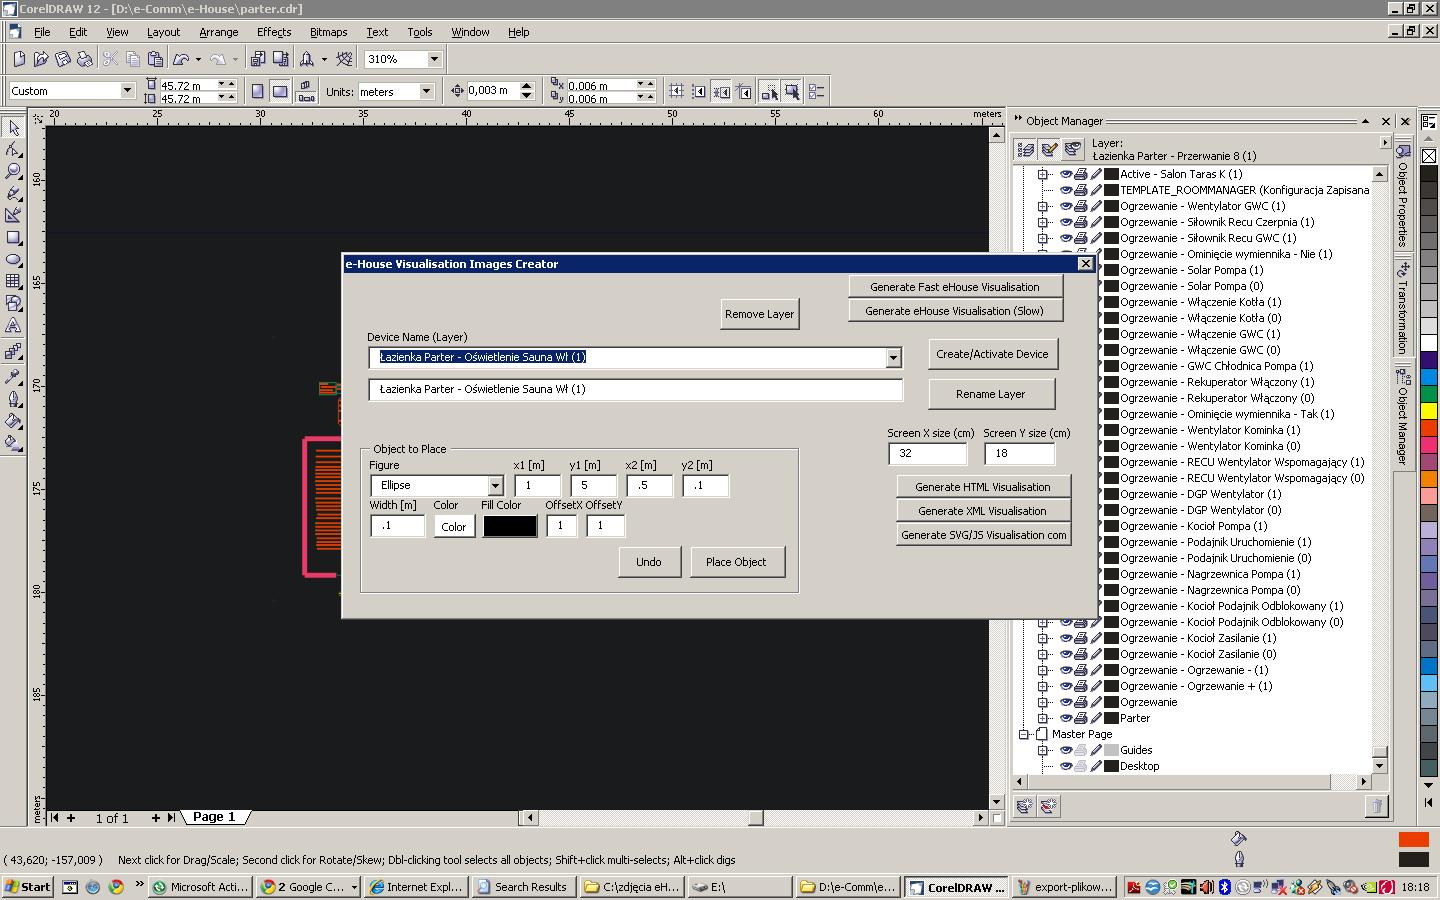
An example of eHouse Visualization view created for an individual project in the Corel Draw application using SVG (scalable vector graphics).
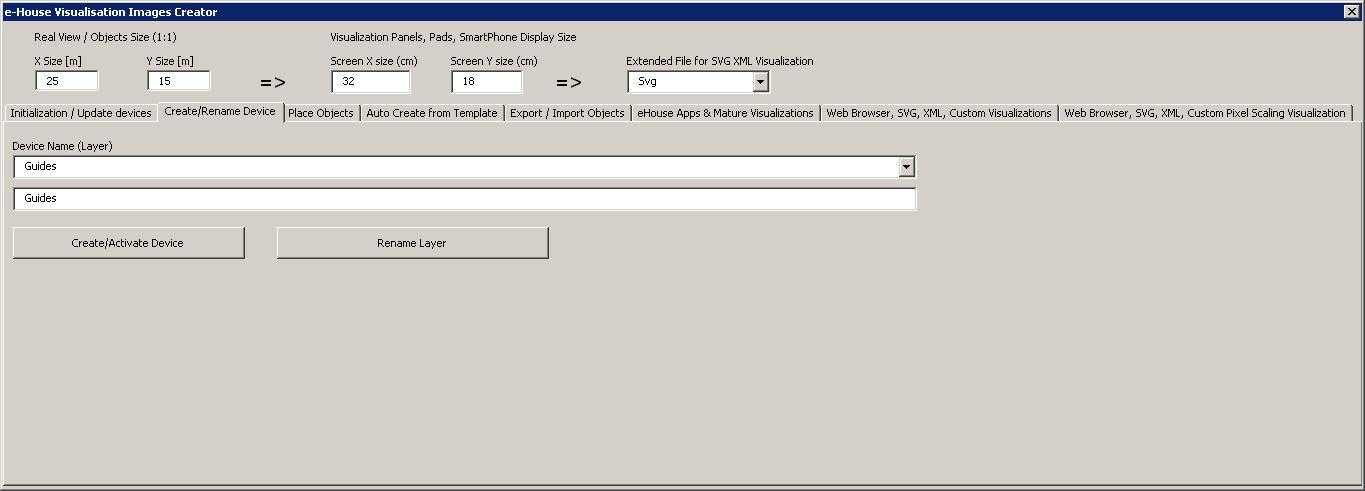
Each eHouse "Active object" (for each state of the signal type: on/off, high/low/ok) is created on a single "Active" layer of the Corel Draw application
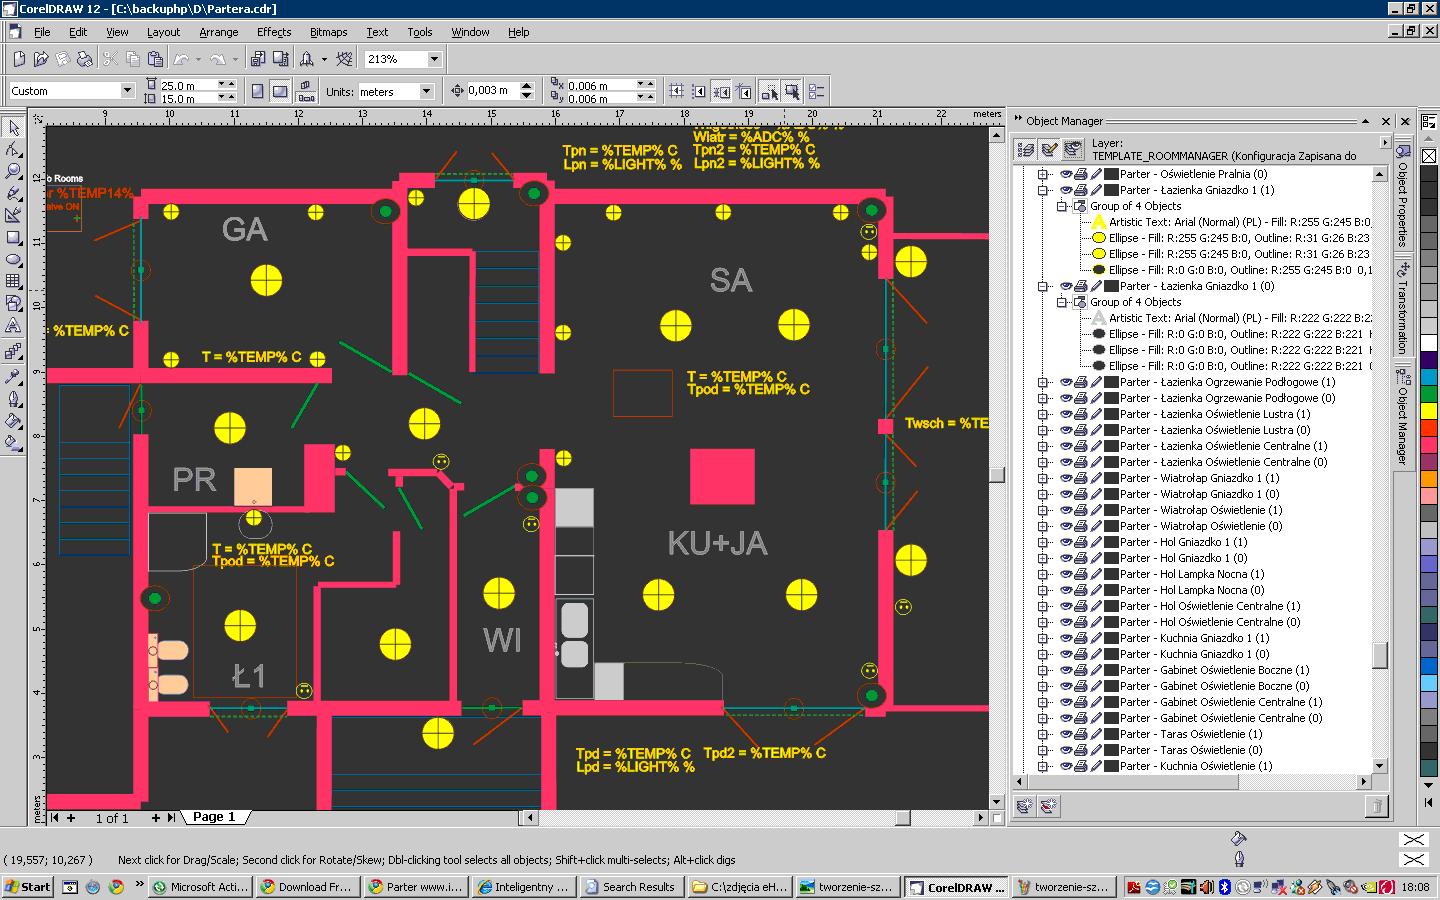
The view is created in 1:1 scale (entered X/Y initial size is in meters.
After initialization of empty "Active Form", walls/lines and other simple objects may be imported to the form in 1:1 scale to neutral layer.
For most flexibility of graphical control & visualization Views (small SmartPhone screens, bad visibility outside, small touch panels), we strongly recommend minimize unnecessary objects on the view to achieve full functionality on 5" smartphones (without zooming and scrolling screens).
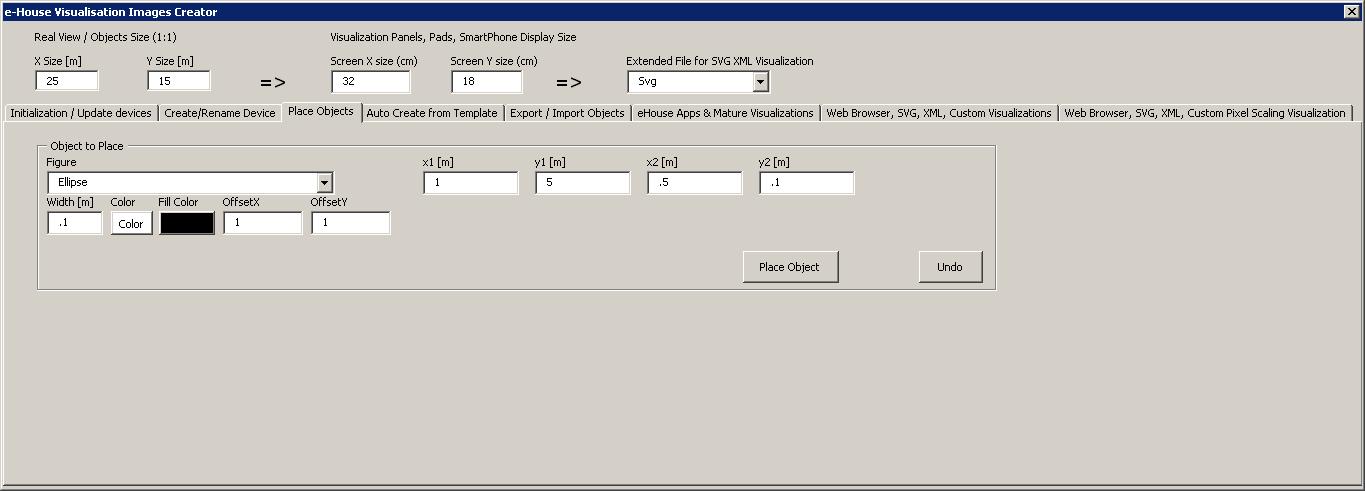
Visualization allows you to create simple "Active" figures and objects assuring high compatibility of displaying for various eHouse visualization standards:
- circle
- ellipse
- line
- rectangle/square with the possibility of rounding
- text
- path
- polygon
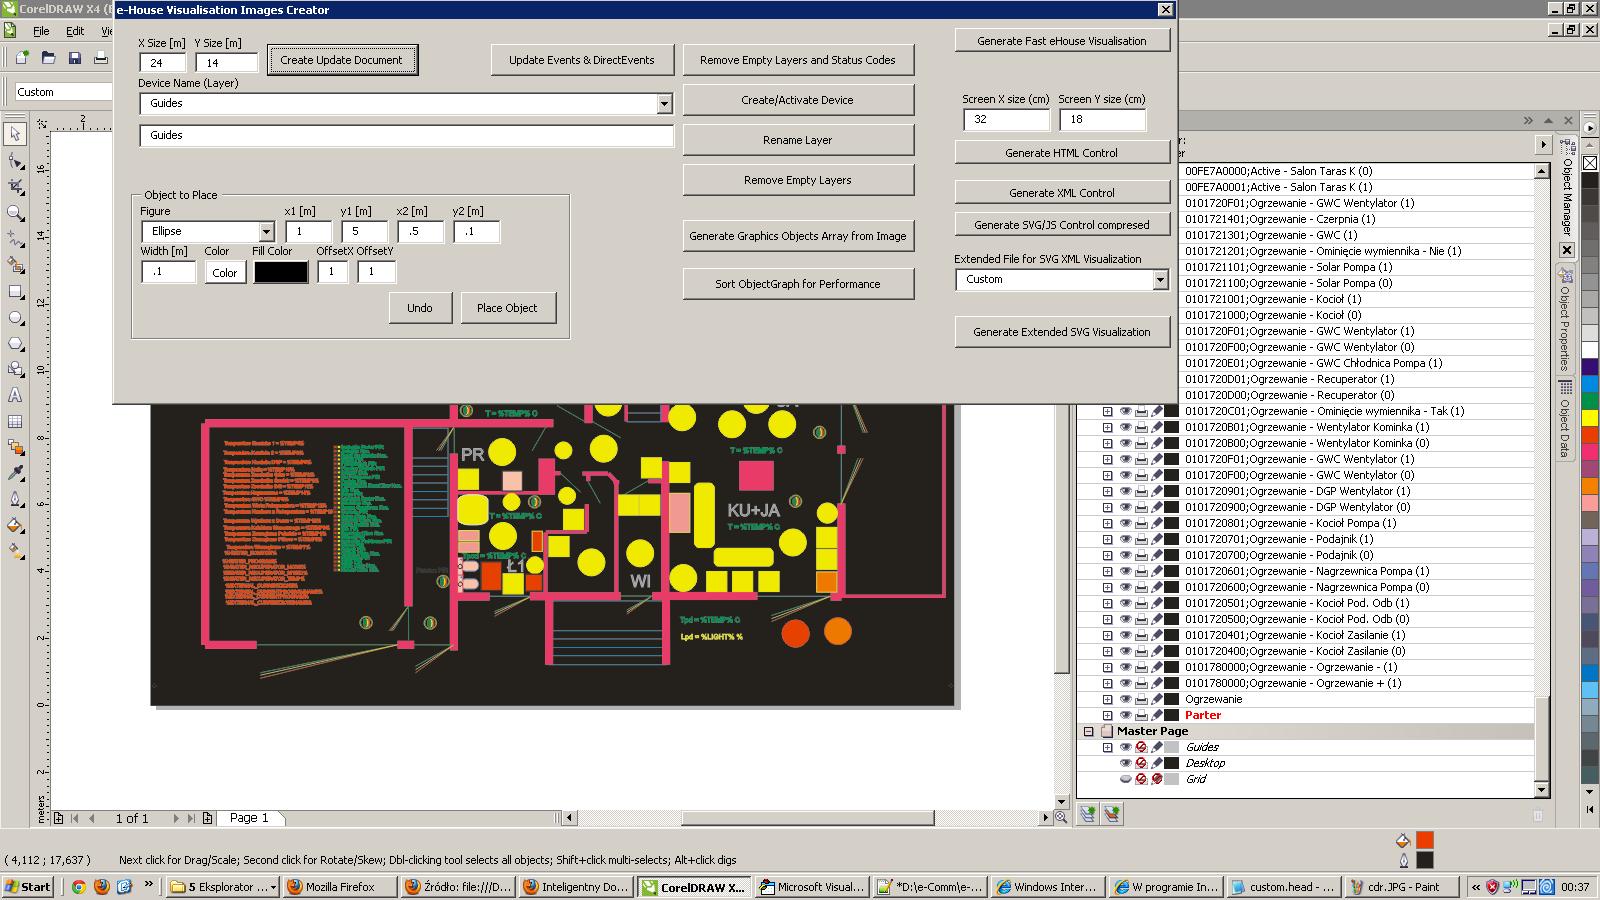
When precision positioning is required, macro supports placing direct objects at the required coordinates.
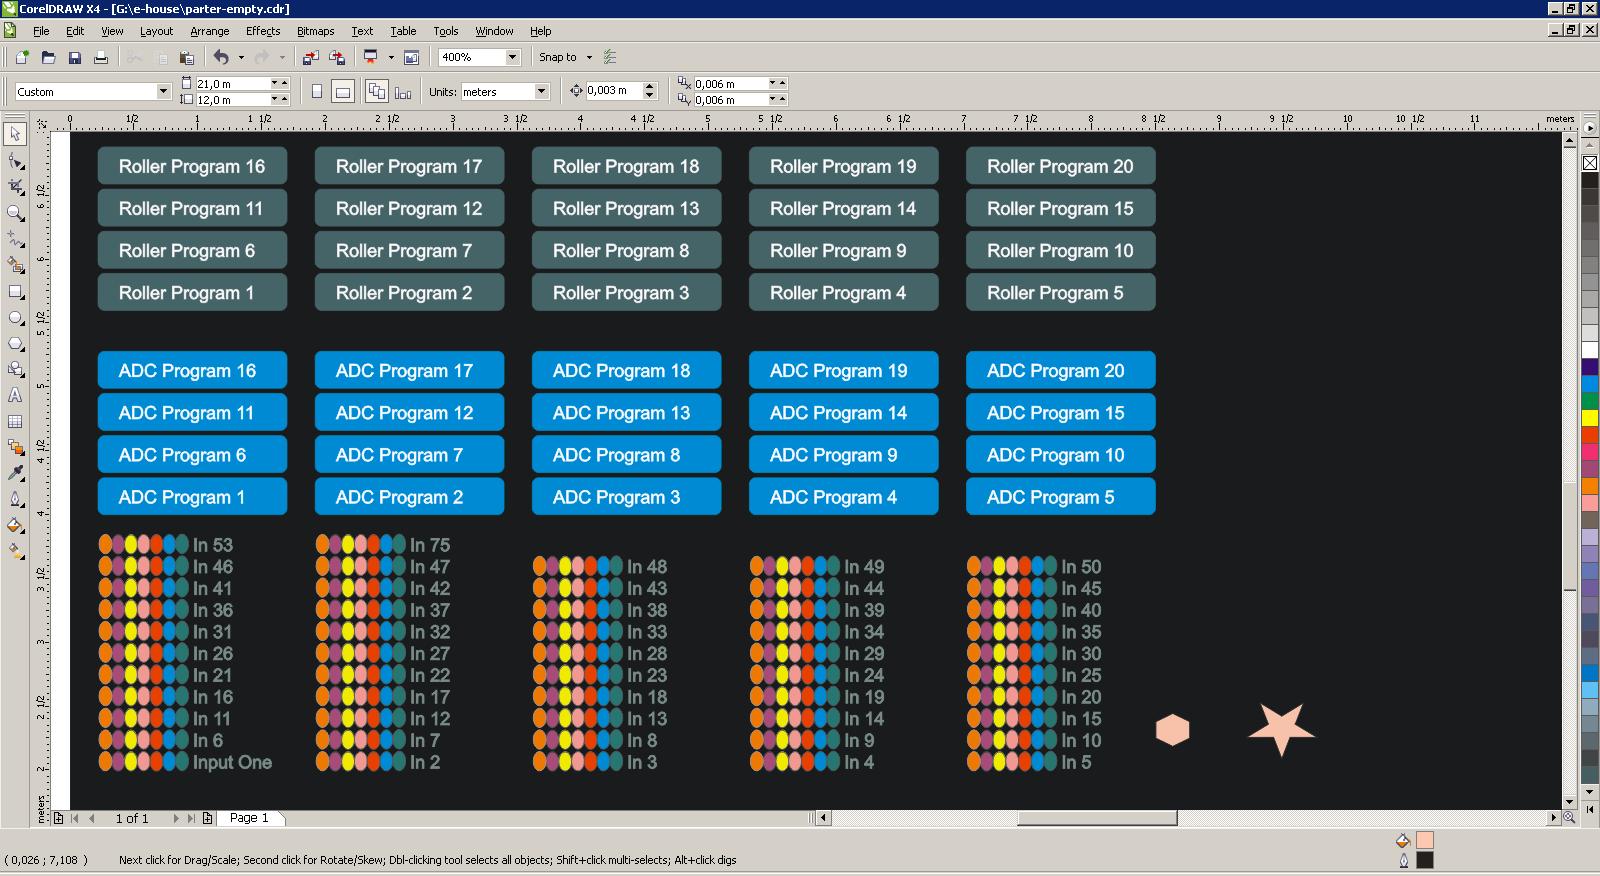
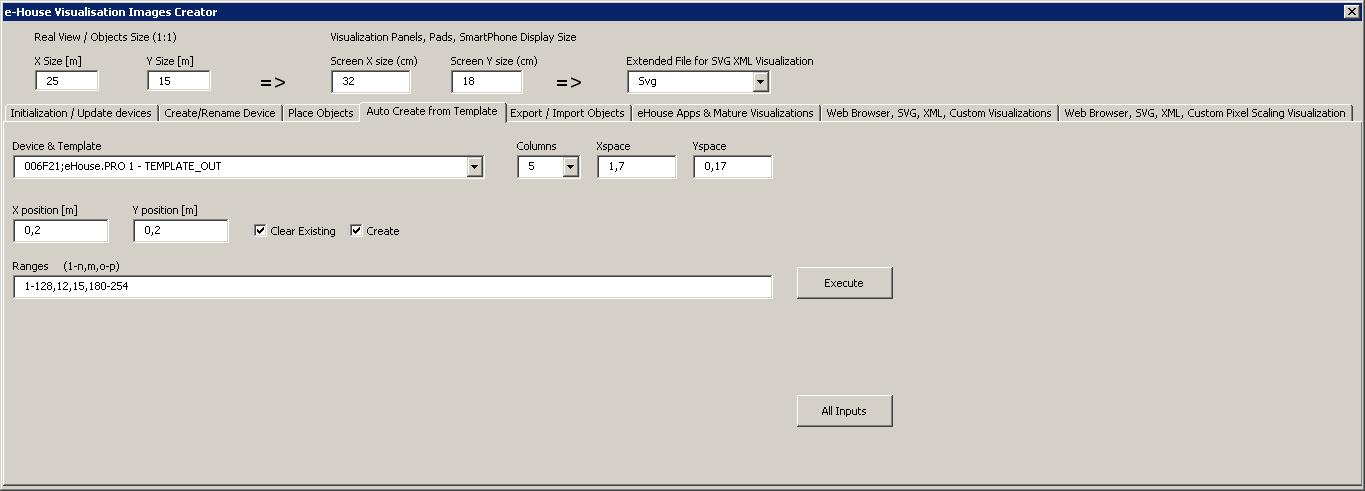
Creating automated visualization based on templates
Automatic placement of "Active objects" on visualization canvas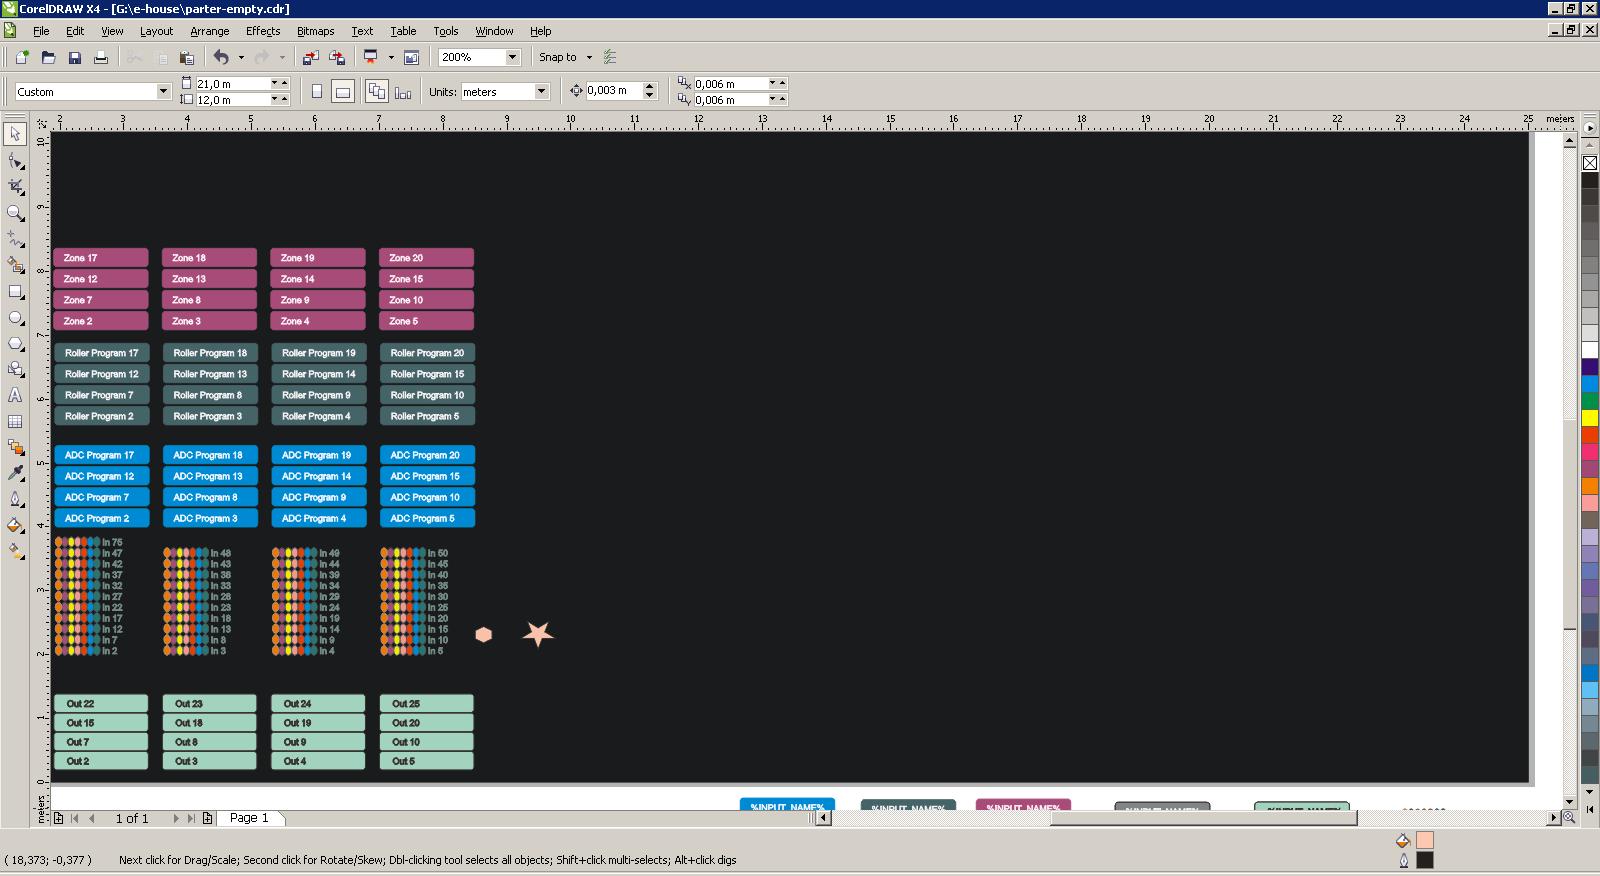
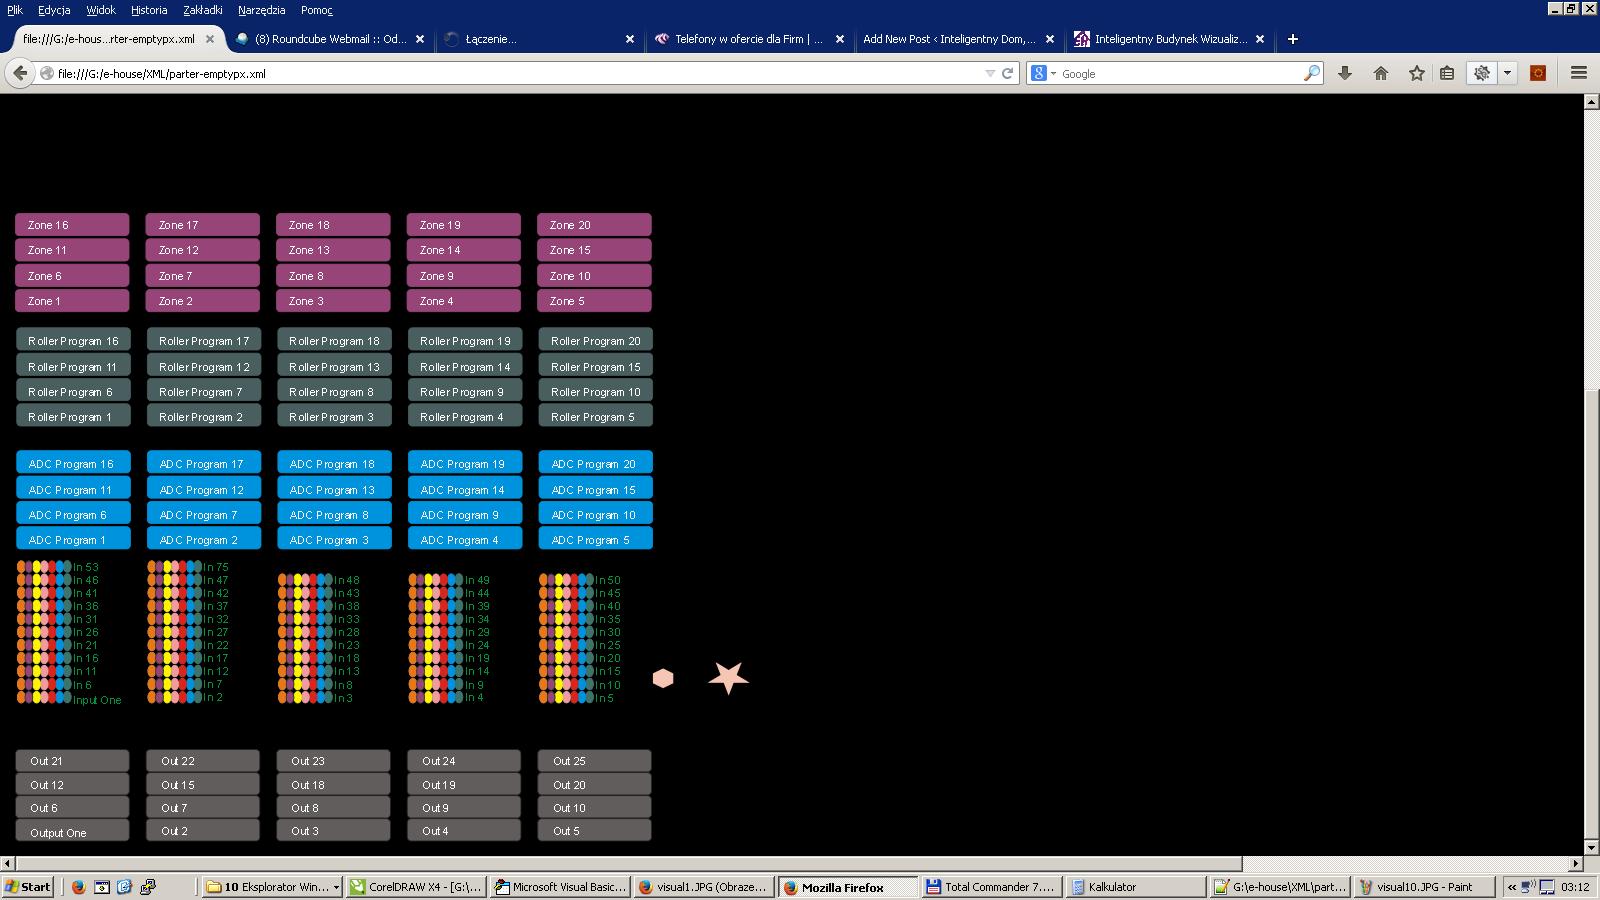
View in a web browser (any supporting natively SVG)
Initialization of visualization and loading of data from the eHouse configuration.
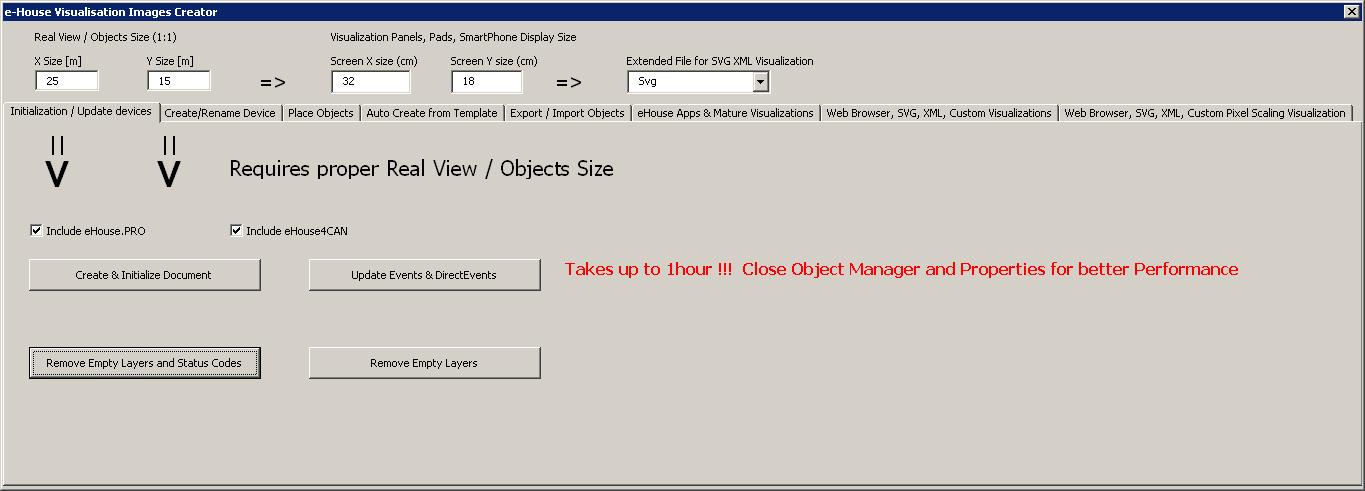
Export visualization data for web browsers, eHouse Visualization applications
Full description of creating a visualization can be found at:
eHouse Building Automation Visualization Creator | PL